
Track-It™ Data Logger FAQs: Setup, Software, and Hardware Guide
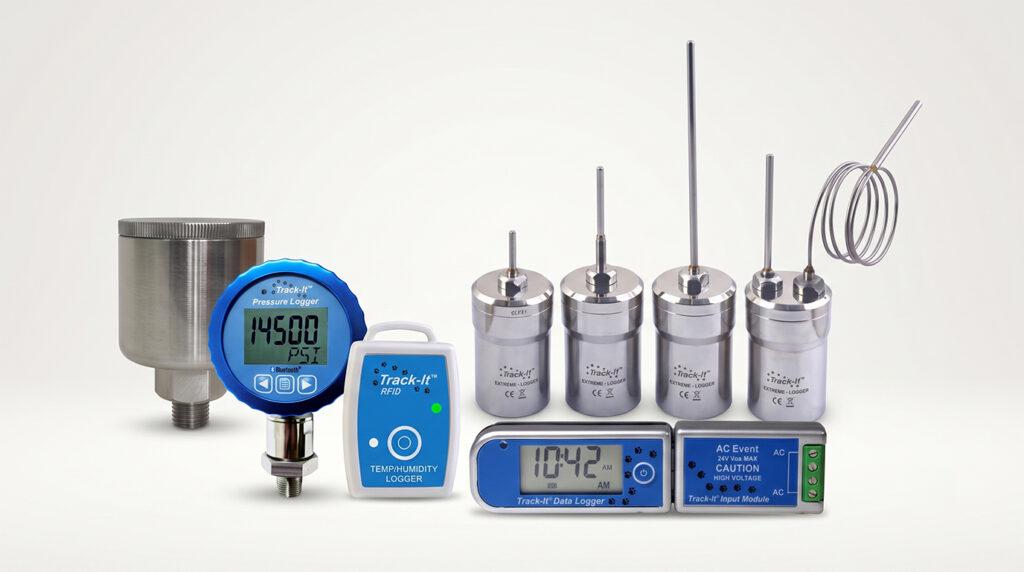
Whether you are configuring your Track-It™ Data Logger for the first time or need advanced data management support, this guide covers essential topics across both hardware and software operations.
Key areas covered include:
- Installation & Connectivity: Guidelines for successful USB driver installation and resolving connection errors.
- Software Operations: Instructions for starting, stopping, and restarting your recording sessions.
- Logger Configuration: Information on setting alarms, scheduling specific start times, and managing cyclic mode.
- Data Management: Methods for uploading, graphing, and exporting historical or real-time data to CSV format.
- Hardware Reference: Details on available sample rates, maximizing battery life, and utilizing the Track-It Transporter Android app.
Use the table of contents below to jump directly to your specific question.
Table of Contents
Software Operations
How do I erase memory and restart a logger?
To erase the logger’s memory and begin a fresh recording session, navigate to the Device Setup tab in the Track-It™ DataLogger Software and perform a Send Configuration. This operation overwrites the existing memory and initializes the logger with your current settings.
How do I stop recording?
Recording can be stopped using either of the following methods:
- Setup Wizard — Launch the wizard and click Stop Recording.
- Device Setup Page — Click Stop Recording in the light-blue Device box located in the lower-left area of the page.
How do I read logger data?
There are three methods to retrieve data from the logger.
Method 1 — Graph Tab Upload
In the Track-It™ DataLogger Software, go to the Graph tab and click the Upload Data button (green up-arrow icon with a U-shaped tray) located in the upper-right area above the graph.
You will be prompted to save the data:
- Click Yes to save the data to your PC and specify a file name.
- Click No to read and display the data without saving. Data may be saved afterward via File > Save in the upper-left corner.
Method 2 — Setup Wizard
In the Setup Wizard, click the Track-It/Manage Data button. This navigates to the Graph tab, where you can follow the steps above.
Method 3 — File Menu
Click the File tab in the upper-right corner of the software, then select Read Device Data. This is equivalent to clicking the Upload Data button and follows the same prompts described in Method 1.
How do I save data to a CSV file for use in Excel?
Historical data and real-time data can each be exported to CSV format.
Exporting Historical Data
- Go to the Data Table tab.
- Highlight the data to export or define a time range in the Report box.
- Select the desired columns in the Include Columns box.
- Click the Save button (floppy disk icon) and enter a file name when prompted.
Saving Real-Time Data Directly to CSV
- Click the Preferences tab and open the General page.
- In the Save Data box at the bottom, select Yes and choose .csv format, then click OK.
- When you click the green dot (•) on the Graph page to begin real-time display, you will be prompted to enter a file name. All incoming data will be saved in CSV format continuously.
Hardware & Troubleshooting
The logger works when connected via USB, but the display turns off when disconnected. What is wrong?
This behavior indicates that the internal battery is depleted and must be replaced. The logger is drawing power from the USB connection rather than its battery.
NOTE: If the unit is new, the battery may have shifted out of contact during shipping. Open the battery compartment and reseat the battery firmly in its holder. If the unit still does not operate on battery power after reseating, please contact Monarch Instrument Customer Service.
Pressure Logger Configuration
My pressure logger reads approximately 14.8 PSI while sitting on my desk. Is it broken?
No, the logger is not broken. This is normal behavior for an Absolute Pressure Data Logger. Atmospheric pressure at sea level is approximately 14.7 PSIA. Because absolute pressure is measured relative to a perfect vacuum (zero pressure), the logger will always display roughly 14.7 PSI when the pressure port is open to the atmosphere.
Gauge Pressure Loggers, by contrast, measure pressure relative to ambient atmospheric pressure. A gauge sensor will always read 0 PSIG when exposed to open air, and the reading will not vary with barometric changes.
Configuring an Absolute Logger to Display Zero
If you require an absolute pressure logger to read 0 in open air, apply a pressure offset using either of the following methods:
Software Offset (Track-It™ DataLogger Software)
- Click the Preferences tab, then click Eng. Units.
- In the lower section of the blue box, check the Use Pressure Offset checkbox.
- Click OK. The logger will now display zero (0) when exposed to open atmosphere.
Internal Hardware Offset (Logger Menu)
The following settings are available in the logger’s Admin menu (must be unlocked):
| Setting | Menu Display | Description |
|---|---|---|
| Zero Mode | ZERO – OFF/EnAb | Enables the zero offset feature. Available in the Admin menu only. If set to OFF, the Zero Set menu item will not appear. |
| Zero Set | ZERO – Set/OFF | Sets the current pressure reading to zero (applies a relative offset). Press the ► button to toggle between Set (relative mode) and OFF (absolute mode). When active, the OFS icon appears on the display. |
NOTE: Zero Set is only accessible when Zero Mode is enabled in the Admin menu and the Admin menu is not locked.
Installation & USB Connectivity
How do I install the Track-It software and USB drivers?
The Track-It DataLogger Software and USB drivers are available as a free download from the Monarch Instrument website. Follow these steps for a successful installation:
- Download the Track-It software package (see the data logger’s product page on this site). The file will download as a ZIP archive — extract all contents before proceeding.
- Important: Do NOT plug the data logger into a USB port before the drivers have been installed.
- In the extracted folder, right-click CD_Start.exe and select Run as administrator. When the installation menu appears, click Install USB Drivers and follow all prompts. If Windows displays an unsigned driver warning, click Continue Anyway to proceed.
- Once the driver installation is complete, click Install Software to install the main application. Accept the license agreement and follow the setup wizard.
- After installation is finished, plug the logger into a USB port. Windows will detect and configure it automatically as a virtual COM port (USB DataLogger COMx).
NOTE: Windows 10 and 11 require administrator access to install drivers and software. In organizations with strict IT policies, an IT administrator may need to perform the installation. Antivirus software (including Windows Defender) may also block the download — temporarily disable it before downloading if needed.
The software shows USB Not Connected. How do I fix this?
A USB Not Connected message is almost always caused by a missing or corrupted driver. To resolve:
- Unplug all loggers from the PC.
- Download the latest Track-It software package and extract the ZIP file.
- Right-click CD_Start.exe and select Run as administrator. Click Install USB Drivers and follow the prompts.
- Once the driver installation is complete, reconnect the logger and relaunch the Track-It software.
NOTE: To verify the driver installed correctly, open Windows Device Manager and expand Ports (COM & LPT). You should see an entry for USB DataLogger (COMx). If the Ports (COM & LPT) category is missing entirely, COM ports may need to be manually added via Device Manager → Action → Add legacy hardware. Contact Monarch Instrument Customer Service if the issue persists.
Does the Track-It software work on Mac or iOS?
The Track-It DataLogger Software is a Windows-only application (32-bit, compatible with Windows 7, 10, and 11). It is not available for macOS or iOS. Users who need mobile data access should consider the Track-It Transporter app for Android devices, which supports data download and logger start/stop via a USB On-The-Go (OTG) cable.
How do I verify my logger is recognized after plugging it in?
After connecting the logger to a USB port, open Windows Device Manager (right-click Start → Device Manager) and expand the Ports (COM & LPT) section. A correctly installed logger will appear as USB DataLogger (COMx), where x is the COM port number assigned by your PC. This number can vary between computers and sessions, which is normal. In the Track-It software, use Devices → Device List to select and connect to the logger if it does not connect automatically.
Logger Configuration & Recording
How do I start the logger recording immediately?
Navigate to the Device Setup tab and select the General sub-tab. Under Start Recording, choose On Send (Now), then click Send Config (Send to Device). The logger will begin recording as soon as the configuration is received.
NOTE: If the Synch Time option is checked, the logger will wait until the current time is an exact multiple of the sample interval before it begins recording. Uncheck Synch Time if you want recording to start immediately upon receiving the configuration.
How does Button Press Mode work?
When Button Press mode is configured, the physical button on the logger serves two functions:
- Quick press — Displays the current logger status on the LCD (current reading, recording state, alarm condition, etc.).
- Press and hold — Hold the button until the green LED flashes, then release immediately. This toggles recording on or off.
NOTE: The Button Press function can be enabled or disabled in the Device Setup → Button tab of the software. Note that if the logger is actively recording due to a Trigger condition, the button cannot stop that recording session.
How do I set the logger to start recording at a specific future date and time?
In the Device Setup tab, select the General sub-tab and under Start Recording choose Start Time. Click Set Start Time to enter the desired start date and time, then send the configuration to the device. The logger will enter ultra-low power sleep mode and begin recording automatically when the scheduled time is reached.
For more advanced scheduling (such as recording on specific days of the week, or setting a stop time), use the Trigger tab under Device Setup. Two independent triggers are available and can be combined with alarm conditions for complex recording scenarios.
What is Cyclic Mode and when should I use it?
Cyclic Mode allows the logger to record continuously without stopping when memory is full. When the memory reaches capacity, the logger overwrites the oldest data and continues recording from the beginning of memory. This ensures the logger always contains the most recent readings.
Use Cyclic Mode for long-term continuous monitoring applications where you need the latest data and historical readings beyond the memory capacity are not required. If Cyclic Mode is disabled, the logger will stop recording once memory is full and must be downloaded and reconfigured to resume.
How do I configure alarms on the logger?
Alarm settings are found under Device Setup → Alarm. Two independent alarms are available, each configurable with its own Channel, Setpoint, Reset Point, and Alarm type:
- Setpoint — The threshold value at which the alarm activates. For a High alarm, activation occurs when the reading exceeds this value; for a Low alarm, when it falls below.
- Reset Point — The value at which the alarm clears. The difference between the setpoint and reset point provides hysteresis to prevent nuisance triggering.
- Alarm Type — Set to High or Low depending on the condition you want to detect.
- Lockout — When enabled, the alarm will not trigger on startup if the initial reading is already in the alarm state. The reading must first move out of alarm range before the alarm becomes active.
- Recording Enable — When checked, the logger will record data whenever an alarm is active. You can choose Continuous (records until manually stopped) or Alarm Duration (records only for the duration of the alarm event).
NOTE: Alarm indicators on the graph display points in a different color when in alarm. Devices with an LCD display will show a bell icon when an alarm is enabled, and separate icons for active high or low alarm states.
How do I assign a name or tag to my logger?
In the Device Setup → General tab, locate the Unit Tag field. You may enter up to 20 characters to identify the logger (e.g., “Warehouse-NW” or “Shipping-Bay-3”). This tag is stored in the logger and will appear at the top of the graph whenever data from that logger is loaded into the software. Individual channel inputs can also be tagged (up to 9 characters each) using the Channel Tag field in the Input tab.
Data Management & Software Features
What data format does the logger use when recording, and how is it accessed?
Track-It data loggers store readings internally in non-volatile proprietary binary memory on the device itself, not as a file you can browse directly. This memory retains all recorded data even if the battery is fully depleted. The data has no standard file format while it resides on the logger; it is transferred to your PC through the Track-It DataLogger Software, which reads and converts it automatically upon upload.
PC File Format — .DAT
When you upload data from the logger and choose to save it, the software stores it as a proprietary .DAT file on your PC. This is the native working format for the Track-It software and preserves all recorded information including timestamps, channel data, alarm states, and configuration metadata. To reopen a saved session, go to File → Open and select the .DAT file.
Export Format — .CSV (Excel-compatible)
For use in Excel or other analysis tools, data can be exported from the Data Table tab as a .CSV (comma-separated values) file. Each row in the CSV represents one recorded sample and includes the date, time, channel value(s), and alarm status columns. The export is configurable so you can select which columns to include, filter by a date/time range, and choose between hh:mm or hh:mm:ss time formats before saving.
Real-Time CSV Capture
When using the live data (real-time) display mode, the software can save incoming readings directly to a .CSV file as they are received. Enable this in Preferences → General → Save Data, select .csv format, and click OK. When you start the live display, you will be prompted to name the file. All real-time samples are written continuously to that file for the duration of the session.
NOTE: The .DAT file format is proprietary to Monarch Instrument Track-It software and cannot be opened by Excel or other third-party applications directly. Always export to .CSV if you need to work with the data outside of the Track-It software.
How do I open a previously saved data file?
In the Track-It software, go to File → Open (or click the Open File icon in the toolbar). Navigate to the location of your saved .DAT file, select it, and click Open. The data will be loaded into the graph for viewing and analysis.
My exported CSV file is only showing one row of data. What is wrong?
This occurs when one or more cells are selected (highlighted) in the Data Table tab at the time of export — the software exports only the selected rows rather than all data. To resolve
- Close the Track-It DataLogger software completely.
- Reopen the software and reload your data file.
- Navigate to the Data Table tab and proceed directly to the Save button without clicking anywhere inside the data table.
How do I compare data from multiple recording sessions on the same graph?
Use the Overlay Graphs tab to display up to six data files simultaneously. Click the Open button within the Overlay Graphs tab, select the files you wish to compare, and click OK. All files are plotted on the same graph using their recorded time and date stamps for synchronization.
By default, channels of the same type share a common Y-axis (Sync Y-Axis is checked). Uncheck Sync Y-Axis to give each channel its own independent scale. Individual channels can be toggled on or off by checking or unchecking their colored boxes in the file list.
NOTE: The Data Table and Summary tabs are not available while the Overlay Graphs view is active.
How do I use the cursor to analyze data on the graph?
Click the Cursor icon on the Graph tab toolbar to enable cursor mode.
Four cursor types are available:
- Value – XY — A single vertical cursor that identifies the exact time and value at a specific point on a trace. Drag the cursor left or right to move along the data.
- All Points — Displays targets on all active traces simultaneously with digital readouts for each channel at the cursor position.
- Period — Places two vertical cursors to measure elapsed time between two events. The minimum, maximum, and average values for all channels within the selected time range are shown at the left of the graph. Click the Summary button to jump to a detailed statistics view.
- Peak — Places two horizontal cursors to measure the amplitude difference between two values, useful for identifying spikes or step changes.
How do I use the Summary tab?
The Summary tab provides a statistical overview of the loaded data set.
It includes two sub-tabs:
- Channel Summary — Shows start and stop times, total sample count, and the maximum, minimum, and average values for each channel. If the Period cursor was used to select a time window before switching to Summary, the statistics will reflect only the data within that selected range.
- Alarm Summary — Lists all alarm events that occurred during the recording, including the time each alarm activated and cleared.
How do I enable password protection and user access control?
User security is disabled by default. To enable it, go to Preferences → Security and check the Enable checkbox. Once enabled, you can create users at three access levels:
- User — Can read and save data from loggers, but cannot change logger configuration or access Preferences.
- Manager — Intermediate access level with expanded permissions.
- Administrator — Full access to all features, including Preferences and user management.
Each user account includes a password, an optional expiration date, an auto-logout timer for inactivity, and a maximum login retry count. If the Audit Trail option is also enabled, all software activity, including communications with loggers and security events, is encrypted and saved to a log file viewable by administrators.
Can I add the unit tag and serial number to exported CSV files?
Yes. In Preferences → Advanced, check the Export Data checkbox. When enabled, the logger’s unit tag and serial number will be included as additional columns in all exported CSV files. You can also check Append Date in the same section to automatically add the export date to the default file name (for example, UnitTag_20250514.csv).
Hardware Reference
What is the maximum number of readings the logger can store?
Track-It Data Loggers store up to 64,000 total data readings in non-volatile memory. Data is retained even if the battery becomes fully depleted. The total recording duration depends on the sample rate you configure. Faster sample rates fill memory sooner. The Device Setup → General tab displays the calculated total record time as you adjust the sample rate, making it easy to plan your deployment.
What sample rates are available?
The sample rate can be set from once every 2 seconds to once every 24 hours, in 2-second increments. The available sample modes for each channel are:
- Instantaneous — Records a single reading at each sample interval (default).
- Average — Samples at the maximum 2-second rate and stores the average value over each user-defined interval.
- High Peak — Samples continuously and stores the highest reading recorded during each interval.
- Low Peak — Samples continuously and stores the lowest reading recorded during each interval.
NOTE: Average, High Peak, and Low Peak modes increase battery consumption because the logger samples at the 2-second maximum rate regardless of the configured storage interval.
How do I maximize battery life?
Several settings affect battery life. Best practices to extend battery runtime include:
- Set the LCD Time Out in Device Setup → Display to a short duration (e.g., 5–10 seconds) rather than Always On, as a continuously lit display draws significant current.
- In the Backlight (BKLT) menu on the logger, select Auto mode so the backlight activates only briefly when a button is pressed, rather than remaining on.
- Limit LED activity. The LED can be set to blink while armed, while recording, or on alarm — each option adds battery load. Disable the LED entirely if it is not required.
- Use Instantaneous sampling mode rather than Average, High Peak, or Low Peak, as the latter modes require continuous 2-second sampling regardless of the storage interval.
- Choose the longest sample interval that still meets your monitoring requirements.
Is logged data protected if the battery dies mid-recording?
Yes. The onboard data storage memory is non-volatile, meaning all readings recorded up to the point of battery depletion are preserved. No data is lost due to a dead battery. Replace the battery and reconnect the logger to the software to retrieve the stored data.
Can I use the Track-It logger with an Android device?
Yes. All Track-It USB Data Loggers are compatible with the free Track-It™ Transporter Android app, available on the Google Play Store. Using a USB On-The-Go (OTG) cable (sold separately), you can connect the logger directly to an Android device to start/stop recording and download recorded data in the field, without needing a Windows PC.